
Myth: Trickle Down Economics Works Since the days of Ronald Reagan, many have promoted the…

Boost Employee Retention and Uncover Hidden Workplace Dynamics
Data Reveals Employees Who Might Jump Ship
In today’s job climate, where unemployment is low and the economy is growing, employers of all sizes are paying attention to not only employee recruitment, but employee retention.
This can be especially important for small and medium businesses who are competing for employees with the big dogs that have seemingly endless resources and billions in annual sales.
When we measure how employees feel about their workplaces with the Spectra Diversity Inclusion Assessment, we aren’t just giving small businesses the tools they need to “measure DEI,” we are giving them the tools to see how their employees feel about the organization as a whole.
Collecting this type of data can help you stay on top of employee perceptions and address what truly matters in building an inclusive, positive workplace culture.
Request a Demo of the Spectra Diversity & Inclusion Assessment so we can walk you through the data we collect and what it can tell you about your workplace culture.
Ignoring Attrition Costs Hurts Your Bottom Line
Why is collecting data so important? Because employees aren’t always going to tell you directly how they are feeling, even as they seek other opportunities.
Let’s consider what we know about women in the workplace according to Deloitte’s Women at Work report for 2024.
Most women only plan to stay with their employer for around two and a half years. Career advancement, learning and development, and work/life balance are key for retention. ~ Deloitte Women @ Work 2024
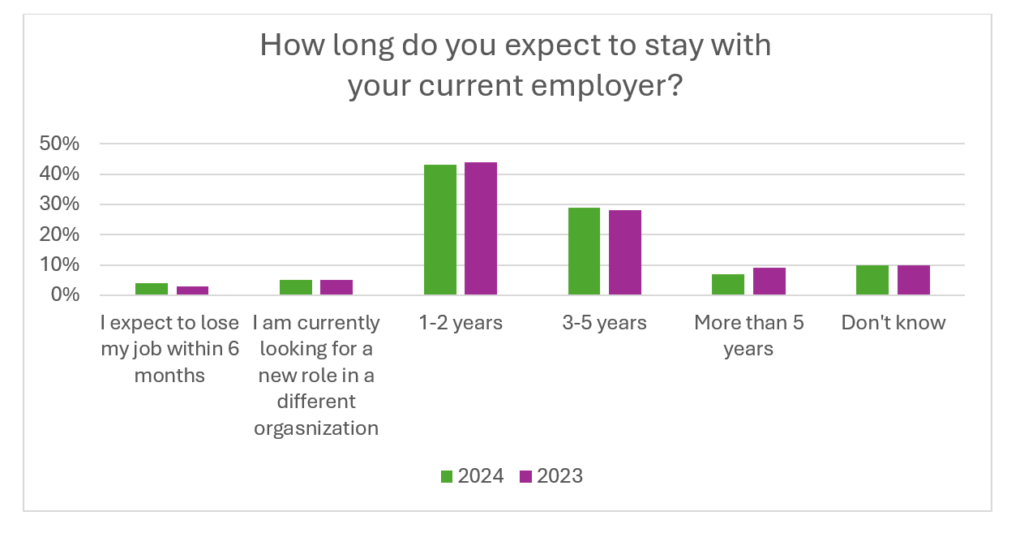 The chart above, from Deloitte’s report, shows more than 40$ of women are thinking of leaving their current employer within 1-2 years, often because of the lack of work/life balance and career advancement opportunities.
Considering that it takes 1.5 years for someone to get hired, trained and perform at the level of the employee who left, that is a considerable financial loss to employers of any size.
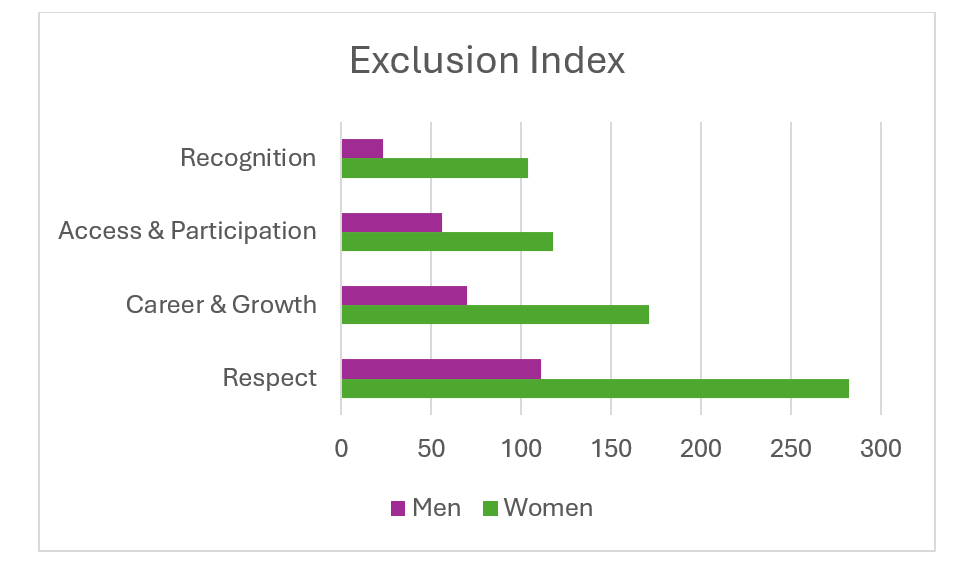
Aleria has a proprietary inclusion calculator – which you can give a try to see the losses in revenue that exclusion might be costing your business. When we review the data for the exclusion vs. inclusion factors that women value compared to men, we see feelings of exclusion are more than two times higher for women than for men.
According to Aleria, how much higher is the exclusion index for women than for men in each category?
- Respect 2.5 times higher
- Career 2.4 times higher
- Access 2.1 times higher
- Recognition 4.5 times higher
The impact on how different groups perceive unfair treatment can be measured, and it can be costly to ignore or downplay these issues as an individual problem.
DEI Data Provides Valuable Clues
When considering diversity, equity and inclusion, it is important to remember that an individual is not diverse. The group is diverse.
So, when looking at who might jump ship and leave your small or medium sized business, it’s important to look at the groups who are disillusioned with either management, the organization’s culture or the policies, practices and procedures which contribute to inequity. Most employee fit assessments, culture assessments, or your annual employee surveys are not going to give you this information.
The Spectra Assessment is Unique
The Spectra Assessment is one of the only assessments on the market that can uniquely give us insights into which demographic groups are feeling exclusion.
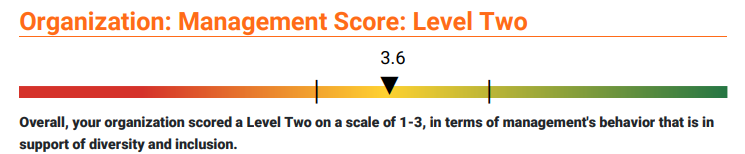
The first image below shows the overall Management score of 3.6 on a scale of 1-5 with a ranking of level two on a 1,2,3 ranking for management support for diversity and inclusion. As you can see the averages (3.6 for all Management statements in our example below) gives an overall view – but averages are not enough.
Enhanced Data Offers More Detail
The images below are from our Enhanced Data Report for the same organization that give the details behind the averages, to help business leaders uncover the issues behind feelings of exclusion in their organizations.
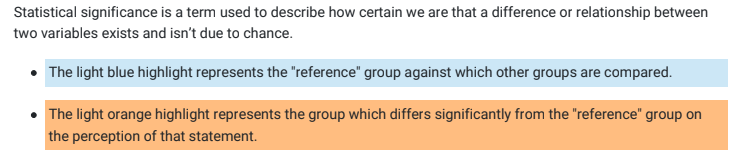
The image below shows the statistical difference between men and women. Pay attention in the data to not only the averages (3.3 vs. 3.6) but the number of responses, and the range from strongly agree (30 vs. 10) to strongly disagree (6 vs. 7). This gives the detail needed to see how employees in these different groups really feel about management holding all employees equally accountable for actions and behaviors.
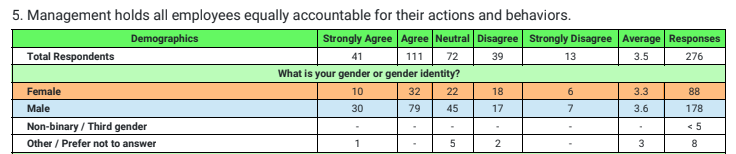
You may notice there is no data for non-binary / third gender individuals. Because there were fewer than five individuals selecting this category,
their score is not shown to preserve anonymity.
The image below, is from the same organization and the same statement “Management holds all employees equally accountable for their actions and behaviors.” In the disability section, there were 20 people who self-identified as having a disability and an additional 20 who preferred not to answer. Twenty who chose not to answer is a higher number than is typical.
With this data, we can see there could be more of a story for this organization to explore to uncover why those who have lower opinions are feeling like management is not holding everyone equally accountable in this organization.
Once again – look beyond the averages to the responses. Strongly disagree is the far left column.
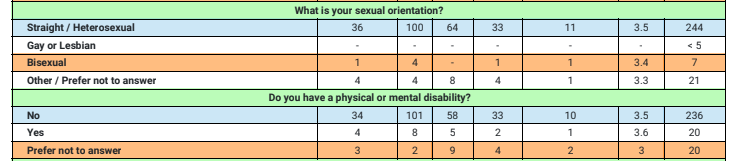
In the demographic groups above, please note that although members of the LGBTQ community are often grouped together, in this case, there were not at least five Gay or Lesbian individual who self-identified so their data is collected but not shown to preserve anonymity.
With the data from the Spectra Assessment in hand, this organization was able to see they had issues with exclusion that were primarily gender-related with disability and sexual orientation as lesser issues. Interestingly, they did NOT have race/ethnicity show up as statistically significant issues in their data as they initially suspected they might.
Focus on Data-driven Retention Strategies
With data in hand, this organization was able to focus their inclusion strategies and leadership trainings on the topics that mattered most to their employees. They implemented targeted interventions aimed at improving gender inclusivity, and tailored their management training to address specific concerns related to disability and sexual orientation. This data-driven approach allowed them to allocate their resources effectively, prioritizing the areas that needed the most attention.
Moreover, the Spectra Assessment can provide them ongoing metrics, enabling the organization to track their progress over time. They can see the impact of their initiatives and make adjustments as needed, ensuring that their efforts are yielding the desired results. By continuously monitoring employee perceptions and experiences, they can stay proactive in addressing any emerging issues before they led to increased turnover.
A More Inclusive and Supportive Workplace Culture is Possible
The benefits of using the Spectra Assessment extend beyond just identifying problems; it also helps in crafting a more inclusive and supportive workplace culture. Employees who feel heard and valued are more likely to remain loyal and engaged, reducing turnover and fostering a more positive work environment. This, in turn, enhances overall productivity and morale, creating a win-win situation for both the employees and the organization.
Don’t let valuable employees slip away due to unnoticed issues. Leverage the power of the Spectra Diversity and Inclusion Assessment to gain deep insights into your workforce’s dynamics and ensure that your small business remains competitive in attracting and retaining top talent.
Get Results with Spectra Diversity
Assessment fatigue is real. Employees want more action, and less talk when it comes to workplace culture. Our short, 10-minute assessment was designed to give you more information, in less time, than other assessments so you can create the positive, inclusive culture that will retain your most important asset – your employees.
Get started today and take the first step towards building a more inclusive and resilient organization or contact us using the simple form below to connect with us to learn more about our data-driven solutions for your workplace.
Related Posts